Circles of Parity: A History
About two weeks ago reddit user AZxWildcat submitted this awesome image to the College Football subreddit.
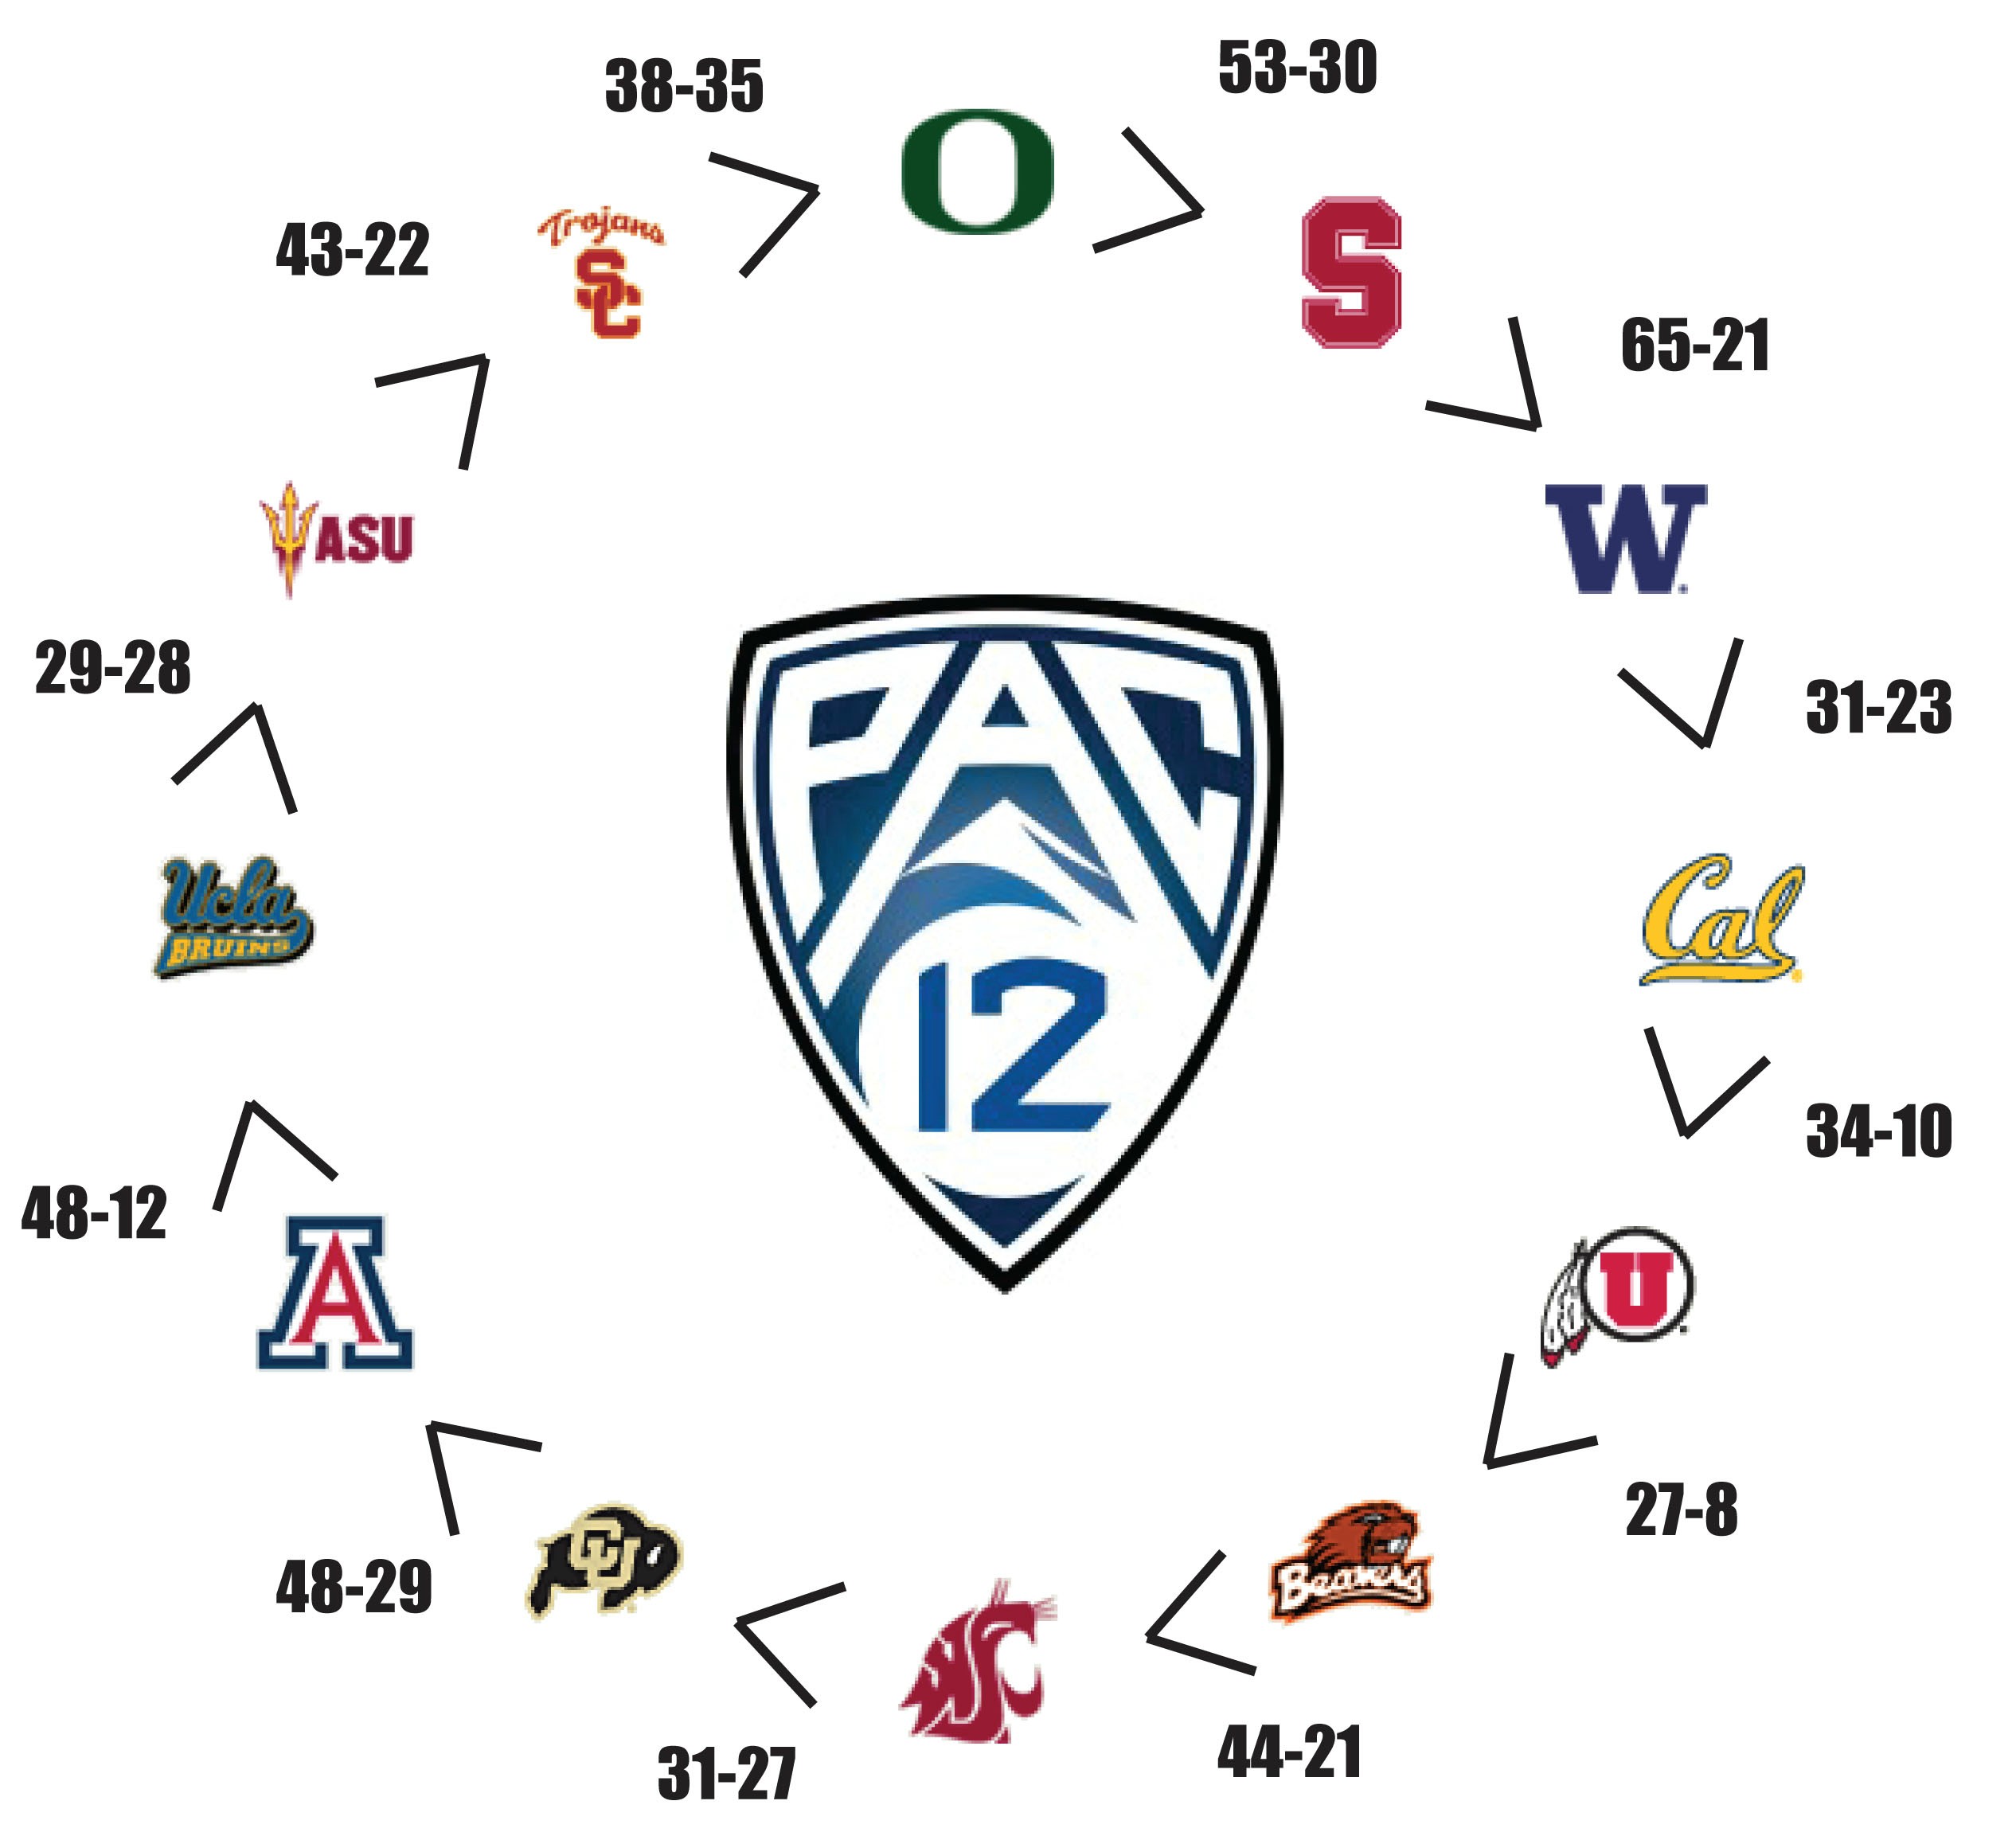
Instantly after seeing this, I wanted to know more. How often does this happen? What year did it happen the most? When did this first happen?
Science Time
My initial hypothesis was that circles of parity occur once or twice a season. To test this statement, I needed every college football game score. Ever. Thankfully, the Internet is a wonderful place.
James Howell, College Football Data King
One Google search later and I landed on James Howell's College Football Scores page. This guy has the score of every college football game going back to 1869. Yes, 142 years of football scores. He also maintains a similar data set of conference affliations. I wrote a fabric script to save all the results locally for further processing.
Analysis
After downloading and transforming the data, it was time to start analyzing. For each year I had a JSON representation of the conference affiliations and a CSV file of football scores. The first step was to create a a directed graph for all the games that year. Each node in the graph is a team. Connections to another node inditcate victory.
Next, for each conference, I took a subset of the overall games graph involving only the teams from that conference. In the graph, a circle of parity manifests itself as a cycle which touches every node one time. In graph theory, this is called a Hamiltonian Cycle. To find these cycles, I first enumerated all paths in the graph. Since I made sure to only visit a given node once within a path, a path is a Hamiltonian cycle if and only if its length is equal to the number of nodes in the graph. With just under a hundred lines of Python my solution was complete.
Results
It turns out my initial hypothesis was correct. A circle of parity will likely form once a season. However, after 142 years of football, there are some really interesting data points.
- Total circles: 134 in 142 years
- Average per year: 0.94
- First circle: 1869 between Rutgers and Princeton
- Conference with most circles: 16 in the Big Ten
- Most in a season: 6 in 2006 with Big 12, Big East, CUSA, MAC, Pac 10, SEC
- Largest circle: 16 teams, WAC in 1997
In 1997 there was a circle of parity between all 16 teams in the WAC.
| Winner | Loser | Score |
|---|---|---|
| Fresno State | Nevada-Las Vegas | 46-28 |
| Nevada-Las Vegas | Texas Christian | 21-19 |
| Texas Christian | Southern Methodist | 21-18 |
| Southern Methodist | Wyoming | 22-17 |
| Wyoming | San Diego State | 41-17 |
| San Diego State | San Jose State | 48-21 |
| San Jose State | Air Force | 25-22 |
| Air Force | Colorado State | 24-0 |
| Colorado State | Tulsa | 44-8 |
| Tulsa | Utah | 21-13 |
| Utah | Rice | 31-14 |
| Rice | New Mexico | 35-23 |
| New Mexico | Texas-El Paso | 38-20 |
| Texas-El Paso | Brigham Young | 14-3 |
| Brigham Young | Hawaii | 17-3 |
| Hawaii | Fresno State | 28-16 |
Absolutely insane.
If you're interested, the full report lists all 134 circles.
Making it Faster
It turns out that finding Hamiltonian cycles is hard. Not just hard, NP-complete hard. Thankfully, my graphs are very limited in size so the report only takes about a minute to generate on my laptop.
Even so, I thought I would give PyPy a chance to work its magic. PyPy is a "fast, compliant alternative implementation of Python" written in Python itself. They aren't lying when they say its fast.
$ time python analyze.py

real        0m52.537s
user        0m51.050s
sys         0m0.066s

$ time pypy analyze.py

real        0m22.758s
user        0m18.952s
sys         0m0.131s
Without changing a line of code, my code saw a 56.6% percent improvement in running time. If you haven't checked out PyPy yet, I suggest you head over the homepage right now and get reading.
Wrapping Up
All my data and code can be found in the circle-of-parity Github repo. Another huge thanks to AZxWildcat, James Howell, and the website where I got some of the cycle detection code (which I have now forgotton).